
Are physicians reviewing cases with your company’s dashboard? Here’s how you can learn what features and data are most important.
At Health Connective, one primary focus is building dashboards and applications for medtech companies. This often goes beyond the initial build of the dashboard or application, as we work with companies for ongoing support and rolling out future iterations.
With all of our clients, we emphasize the need to evaluate the application at each phase so that the next iteration can be that much better for users. That includes soliciting feedback from key user groups, but there’s also another form of evaluation that your team may not have thought of: analytics.
It’s common for medtech companies to use analytics to track the public-facing parts of the company’s offerings, particularly the public website. But there is also a great opportunity to use analytics to track behavior on the things that aren’t available to the general public–specifically, your dashboards and applications that are used by customers, team members, etc. These insights can highlight unexpected behavior and inform future iterations of your dashboard.
In addition to using analytics for our own purposes as a company, we’ve also used it to help clients track user behavior in dashboards. These are some of the things we have learned.
Best for Analytics Tools for Tracking Dashboard Usage
Because dashboards are typically gated behind a login, traditional (and free) tools like Google Analytics often aren’t going to get you the level of detail you need, at least, not without a tremendous amount of customization. Fortunately, there are paid analytics tools that are much more robust and allow you to obtain really useful insights.
The tool that we’ve started using for dashboard tracking and even general website analytics is Matomo. Matomo has given us the ability to track user behavior behind the login area, and also has many customization capabilities to ensure we are capturing the metrics that are most useful to our clients. While it is a paid tool, the cost is not outrageous by any means, especially compared with the valuable data it has provided.
There are other paid analytics tools that can provide similar types of reports, but Matomo is the one we have the most experience with.
Reports & Metrics We Track for Surgical Dashboards
There are many different types of reports and metrics we can track in Matomo, but these are some of the most useful things we’ve set up and tracked for our clients.
Customization & Detailed Tracking Options
Even with a paid analytics tool, if you are just installing the basic tracking code and running your reports, you likely aren’t taking full advantage of all that the tool can offer you. In analytics tools like Matomo, there are customization and detailed tracking options that can help you take your reports to the next level and tailor them to your dashboard. These things include:
- Setting up custom metrics
- Segmentation
- User ID tracking
Custom Metrics
Paid tools will usually give you the option to feed custom metrics into your reports so that you can track user behavior based on the criteria that actually matters to your company. For example, if your dashboard has multiple user roles or other user account features that you want to track, an analytics tool wouldn’t automatically pull that information in with the basic installation. However, you can set up custom metrics to pull that data in so you can see how different user types behave on the dashboard.
Segmentation
Once you have all of your custom metrics set up, you can build segments based on the criteria you most want to track. Segmentation allows you to quickly slice the data down to just the things you want to see. For example, you might want to build a segment to see reports for just one type of user role, or see how behavior differs between your internal team and customers. One of the surgical dashboards we built had the following user types who had very different needs for using the dashboard, and segmentation allows us to get a better idea of user behavior within each role:
- Physicians, who use the dashboard to review their case details and procedure videos.
- Clinical administrators, who need to review case data in aggregate to evaluate outcomes of the procedure at a hospital-wide level.
- IT security teams, who need to verify that data security protocols are in place to protect patient data.
- Engineers, who need to monitor systems in the dashboard to ensure the device is functioning properly.
User ID Tracking
User ID tracking is one of the key metrics that you can get from a paid tool like Matomo that you cannot get from a free tool like Google Analytics. Any analytics tool can give you insights into user behavior in aggregate, but being able to track behavior by individual users allows you to identify your power users to see who you can go to for additional feedback on the dashboard. It can also help you identify whether a user-reported issue is an anomaly or a trend that needs to be addressed.
Other Useful Metrics
These are some of the more standard analytics reports you can pull that may be helpful in analyzing user behavior on the dashboard.
Downloads
If your dashboard has downloadable content, a downloads report can tell you what is being downloaded and which users are downloading content.
Video Interaction
Depending on the video player you use, you may have to add some custom tracking to pull in all the information you need, but you can usually get data on what videos are being played, how far into the videos users are going, and how they are interacting with the video. For example, are they pausing a lot or using the seek feature to skip around?

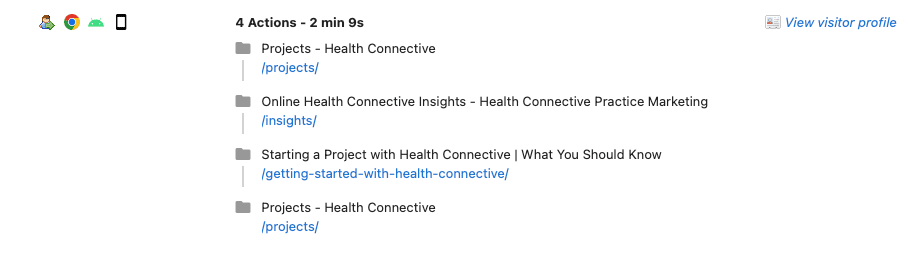
Pageviews
Combined with segmentation, you can see which pages are most popular for different user groups. A pageview report can also show you if error pages show up frequently so that you can investigate further if needed.
Page Load Times
This report can help you keep track of your load times and see if there are any pages that are loading more slowly than expected.
Locations
If you have users all over the country or even multiple countries, you can see which locations have the most active users.
Browser and Device/Screen Size
With these reports, you can see what types of browsers, devices, and screen sizes are used the most so that you can optimize the dashboard for those users as a priority.
Heatmapping
Analytics tools typically track behavior based on clicks, page loads, and other predefined actions. However, that may not always give you the full story. Heatmapping can help you track things like mouse position and scrolling that you wouldn’t be able to get from other types of analytics reporting. It can also be helpful in identifying non-link elements that users try to click on, which can help to inform design decisions. Heatmapping is included with Matomo, but may not be included with other analytics tools. You can purchase separate heatmapping tools if needed.
With all of the reports and metrics described above, the goal is to understand how your key user groups are interacting with the dashboard so that you can make data-driven decisions for future iterations, rather than trying to guess what your users want and need. As we’ve said before, sometimes what users say they want isn’t actually what they need. Analytics reporting can help your team figure out what users actually need so that you can ensure they keep coming back.

As the marketing manager, Ashley ensures that our clients’ marketing strategies are put into action. This includes content writing, SEO, online advertising, analytics, and interfacing with the tools, systems, and team members needed to help our clients accomplish their marketing goals.